Main features More to come!
Spots map view
The spots map, together with the spots search, is the main interface to get wind and waves alerts, since data shown in the alerts ticker corresponds to the spots that appear on map. When you move the map or change the zoom level, map spots and ticker alerts are instantly updated, showing the current alerts for the spots on map.
Thus, by adjusting the ticker filters to the desired conditions and moving the map to the areas to explore, instantly we'll see if there are spots with favorable forecasts for the next 7 days.
-
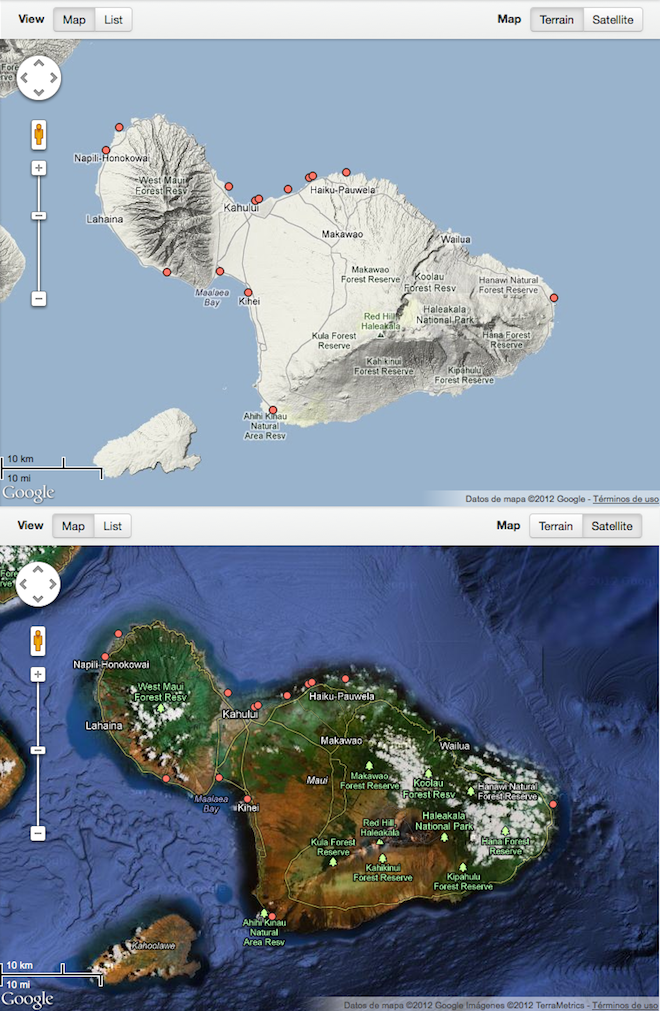
Maui's spots Terrain and Satellite map views.
Spots list view
While browsing spots around the map (map view), at any time you can switch to list view. When going from map view to list view, all the spots we had in the map are now sorted in a list. The spot list is sorted by popularity.
From the list view, for each spot you can access the alerts around (forecast summary), the forecast details, and the spot statistics. You can also select multiple spots to compare forecasts.
-
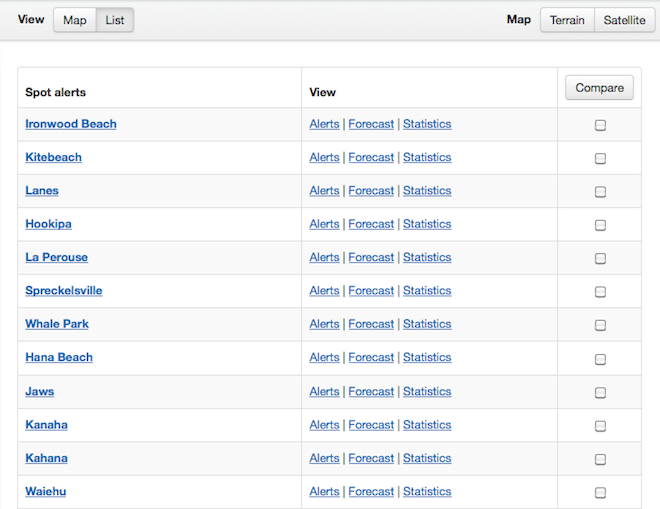
Maui's spots list view.
Spot statistics
For each spot, from the forecast details page, you can access to a full report with wind, waves and weather statistics that is generated from historical forecasts data. The data stored does not correspond with the real occurred conditions, but with forecasts. The date from which historical data is stored for each spot is shown at the top of the page.
Wind Strength and Waves Size graphs show by months the number of days with all alert levels. Both graphs can be filtered by Wind or Swell Direction. For example, you can get the number of days and the alert levels at Hookipa with swell from E (East).
Wind Direction and Swell Direction graphs show the percentage of days for each cardinal components. Both graphs can be filtered by Alert level or by Month. For example, comparing the swell components at Hookipa for sizes 0-1 m and for sizes 3+ m, we can clearly see that the component that brings bigger swells is NW (Northwest).
Finally, there are also graphs for Air temperature and Monthly rain.
-
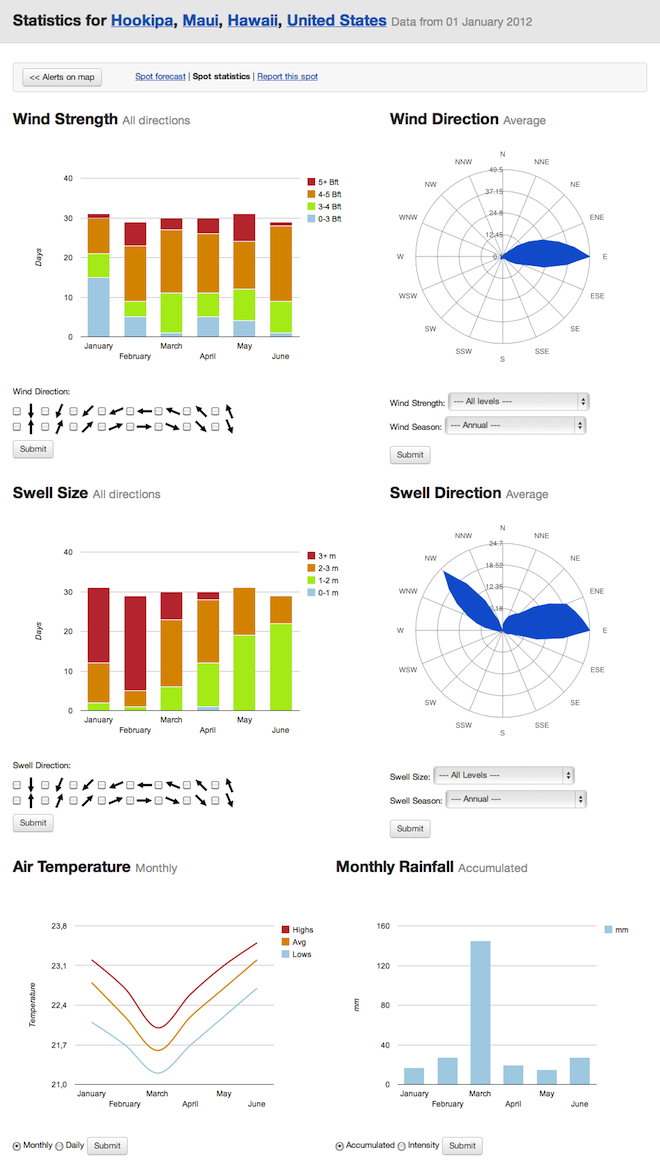
Wind, waves, and weather Statistics for Hookipa.
Forecast compare
Forecast compare is a powerful tool that will allow you to quickly analyze the differences between several spots forecasts.
Spots to be compared can be selected:
- From countries spots lists
- From spots map (List view)
Once selected the spots you wish to compare, all detailed forecasts will be loaded in one single page. To facilitate comparison, it is possible to hide/show wind, waves, tide and weather data blocks.
-
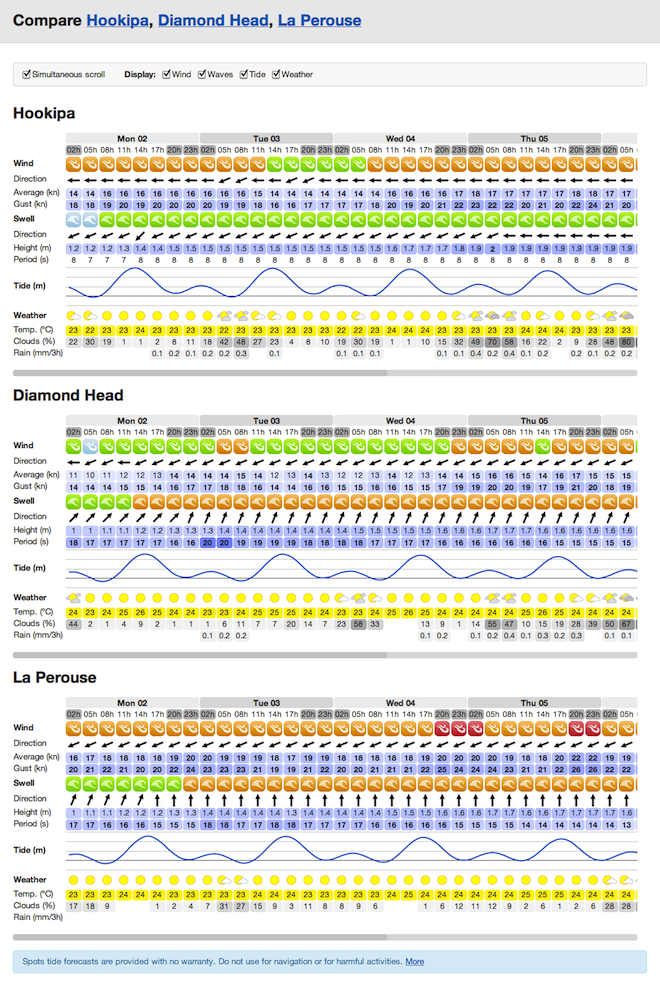
Forecast comparison between Hookipa, Diamond Head and La Perouse.
Tide forecast
Tide forecasts are calculated from some parameters called tidal harmonic constituents, based on historical tide measurements. We are using XTide for those calculations.
Tidal harmonic constituents are publicly made available for major ports, but unfortunately they are not available for every location. So for each spot, we are providing tide forecasts when they are close enough to reference ports with known harmonic constituents.
Consider that spots tide forecasts may not be completely accurate due to:
- Tide varies in locations away from the reference ports.
- Harmonic constituents of certain ports may be outdated.
However, we provide spots tide forecasts based on close ports tide forecasts. Note than the farther will be the spot from the reference port, the greater could be the tide forecast error.
-
Forecast details for Hookipa now comes with tide forecast.
Add spots
Now anyone can add spots, it's easy and fast. Just select spot's country, fill some details, and drag the marker to the exact spot's position. The new spot will be instantly created and its forecast will be available immediately.
However, an administrator will check the spot once created, and will reject it if its name or location are wrong, or if it's not a public interest wind or wave spot. In case of rejecting your spot, you'll get a specific reason.
-
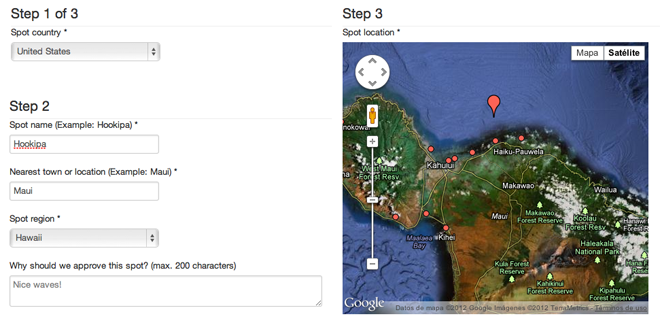
Adding a spot in 3 simple steps.
Forecast details
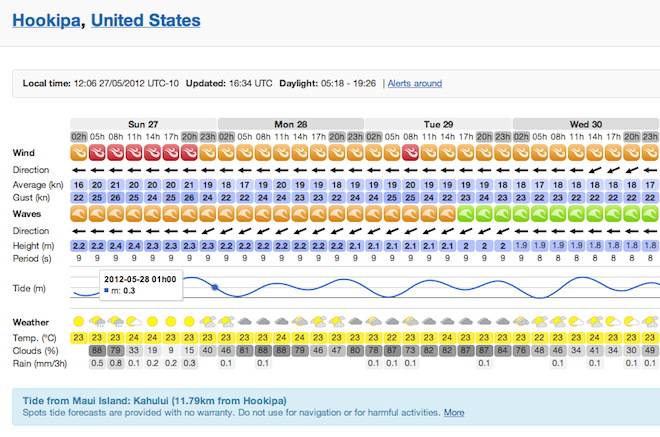
You should already be familiar with raw wind and wave data forecast tables, others are providing really nice tools for years, but we think it should be possible to make them more readable and useful.
Our little contribution was to add some wind and wave alert levels icons to all time ranges calculated from wind and wave forecast data, making easier to quickly locate the desired forecast conditions.
Wind alert level icons
They are calculated mainly from the Average wind strength data sets, but also the Gust wind strength is taken into account. High gust values will increase the wind alert level for that time range.
Wave alert level icons
They are calculated mainly from the waves Height data sets, but also the waves Period is taken into account. High period values will increase the wave alert level for that time range.
-
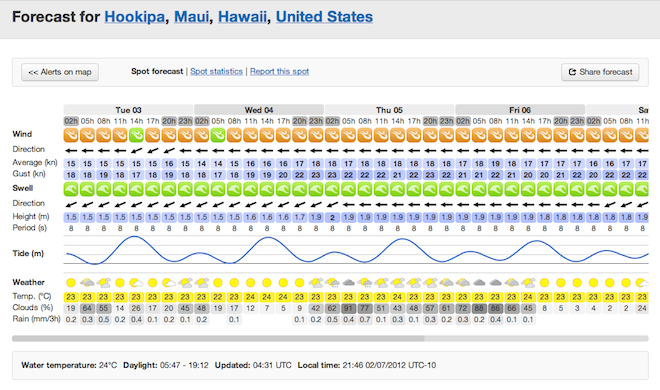
Wind and wave forecast details for Hookipa.
Forecast summary
Forecast summaries for each spot are displayed on the map and allow to check wind and wave forecasts at a glance. Clicking successively on ticker alerts and checking forecast summaries is a quick way to find the spot with your desired best conditions in particular area.
They provide a 7 or 8 days forecast with the strongest wind and wave daily conditions (at local daylight time). It could happen that time ranges for strongest wind forecast and for strongest wave forecast are different, but according to the kind of conditions you're looking for, you will be able to easily find the most suitable forecast for you. You can check strongest conditions time ranges rolling mouse over the wind and wave alert icons.
Clicking the spot name will drive you to the forecast details for that spot.
-
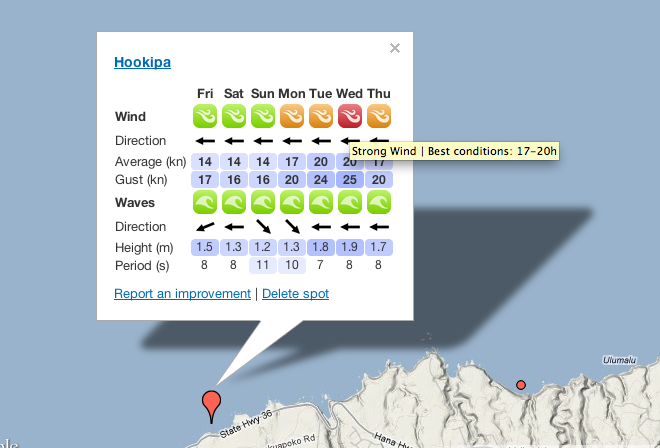
Wind and wave forecast summary for Hookipa.
Ticker filters
The alerts ticker comes with some cool filters that will help you to find your desired wind and/or waves forecasts. By default, filters for all wind and waves levels are enabled, so all wind alerts or waves alerts will be displayed in the alerts ticker.
-
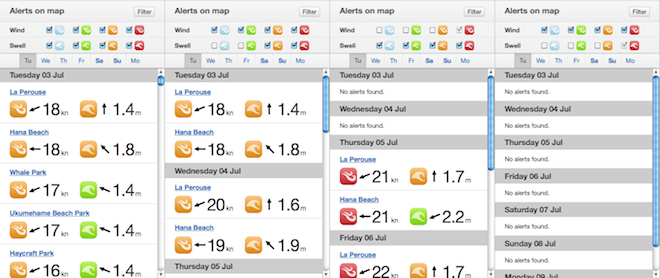
Different wind and waves filters combinations.
Alerts ticker
The alerts ticker is an amazing tool that will allow you to discover alternative spots with the best possible forecasts in a given area. The ticker is linked to the spots displayed on map, so when zooming in and out or moving to other locations, ticker alerts will change to cover the spots from that new location.
When searching spots or zooming the map, the alerts ticker will extract most relevant spots from all spots displayed on map, and will group all alerts for that set of spots by weekdays. For each day, it will sort spot alerts from highest to lowest alert level.
That way, given a map area, you will always get the best possible conditions for the spots within that area, grouped by weekdays.
-

Each alert tick is linked to the spot forecast summary.
Alert levels
Wisuki categorizes wind strength and waves size in 3 alert levels (high, medium, and low). Alert levels are associated to code colors as shown in the following table. The fourth color is the non-alert level. Roughly, alert levels match with rider levels (advanced, intermediate, and beginner).
Alert levels code colors make forecast tables more readable, but they also allow to condense wind or wave daily forecasts into one single icon, with the daily strongest conditions. This is the basis of interesting new features like weekly forecast summaries, or the daily alerts ticker.
| Wind | Conditions | Wave | Conditions |
|---|---|---|---|
 | Strong wind Average > 22kn* |
 | Big waves Height > 3m** |
 | Medium wind Average > 16kn* |
 | Medium waves Height > 2m** |
 | Light wind Average > 12kn* |
 | Small waves Height > 1m** |
 | Very light wind Average < 12kn* |
 | Very small waves Height < 1m** |
- * High wind gusts
- Will enable this alert level with lower wind average values.
- ** High waves period
- Will enable this alert level with lower waves height values.
Spot search
It has never been so easy to find any spot around the world. Just start typing a spot name and Wisuki's autocomplete search box will show you up to 10 suggested matches. If you are not sure about the exact spelling, just try typing.
When selecting a spot suggested match, you will get a forecast summary for that spot on a map, and all nearby spots within the searched spot area.
Spot search example: Hookipa
If you don't remember the spot name, no problem! Just type any location, and you will get all spots in that location. A location can be a country, a region, an island or a town.
Location search examples: USA, Hawaii, Maui
-
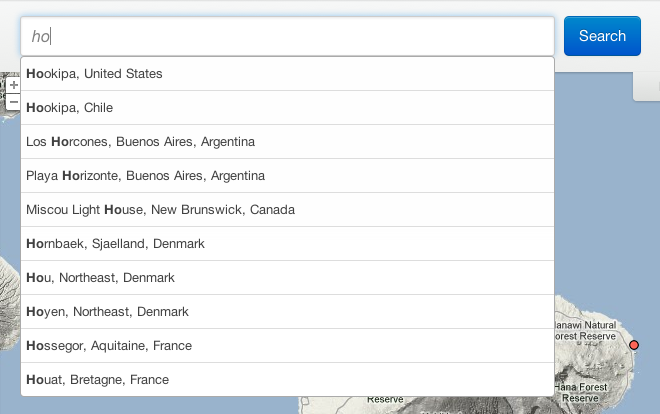
Wisuki's autocomplete search box shows up to 10 matches.